From Overwhelmed to Optimized - It's like having
your own team of technical analysts 24x7x365
preparing YOUR favorite assets technical analysis and signals for you.
If you're serious about profitable trading—this platform is your new foundation.
Many people skip asset selection - too time consuming, too hard or don't know how.
This platform HELPS YOU QUICKLY select the right assets at the right time via data driven signals & MTFA visualizations.
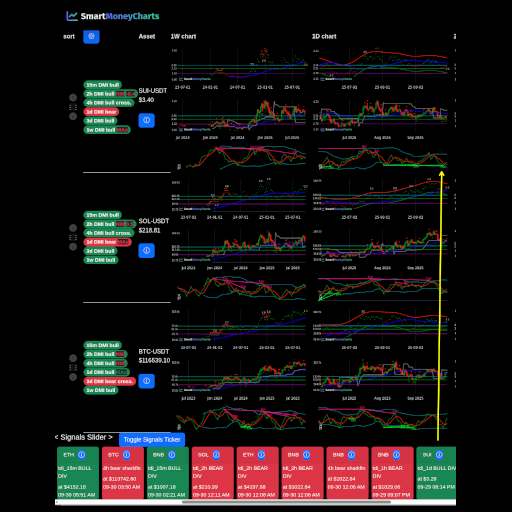
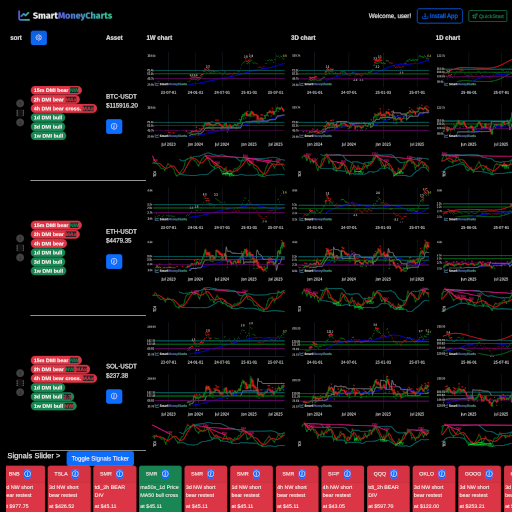
Asset charts & indicators in list of rows. Simply scroll to review & compare top indices, stocks, cryptos, etfs and insightful virtual pairs.
Easily see the market's best opportunities, discounts, reversals...No more losing focus, clicking between watchlist assets and timeframes. Eliminate wasted clicks, memory overload.
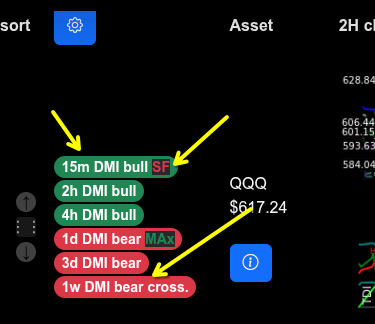
Multi-Signal multi-timeframe summary sits next to each ticker.
Save time and sharpen focus—new traders gain clarity, pros gain speed.
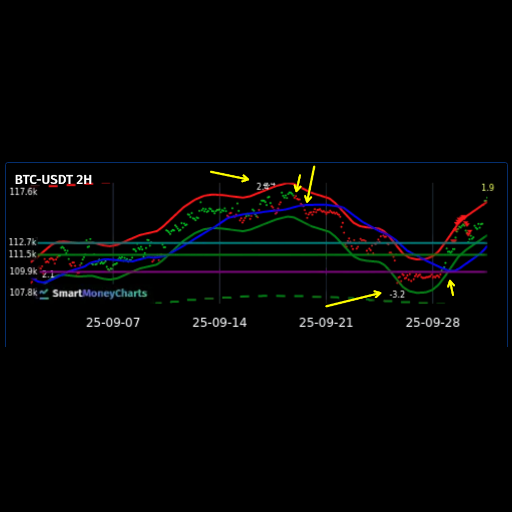
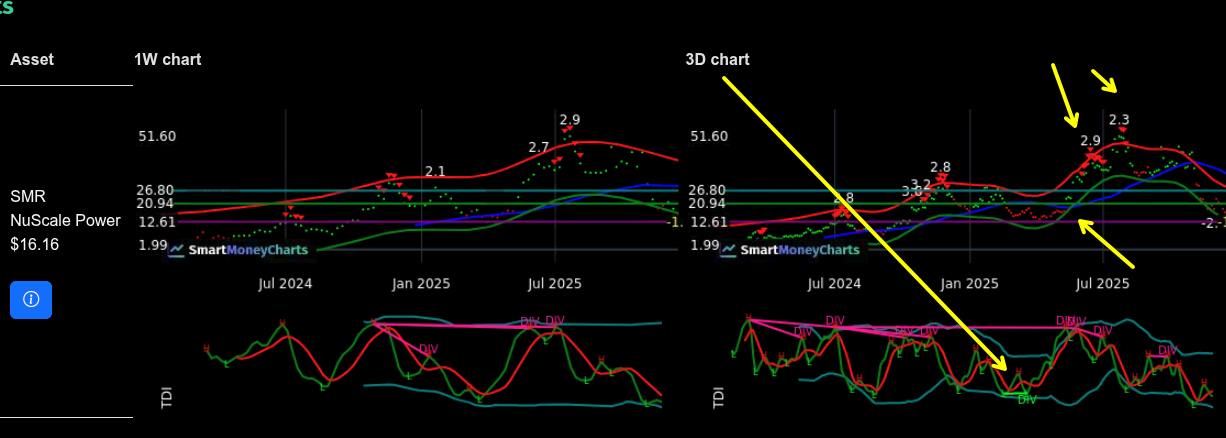
All timeframes visible, side-by-side, charts and indicators, from 10d down to 15m. Often one timeframe reveals a key divergence or signal others wont.
Eliminate blind spots—build consistency whether you're new or experienced.
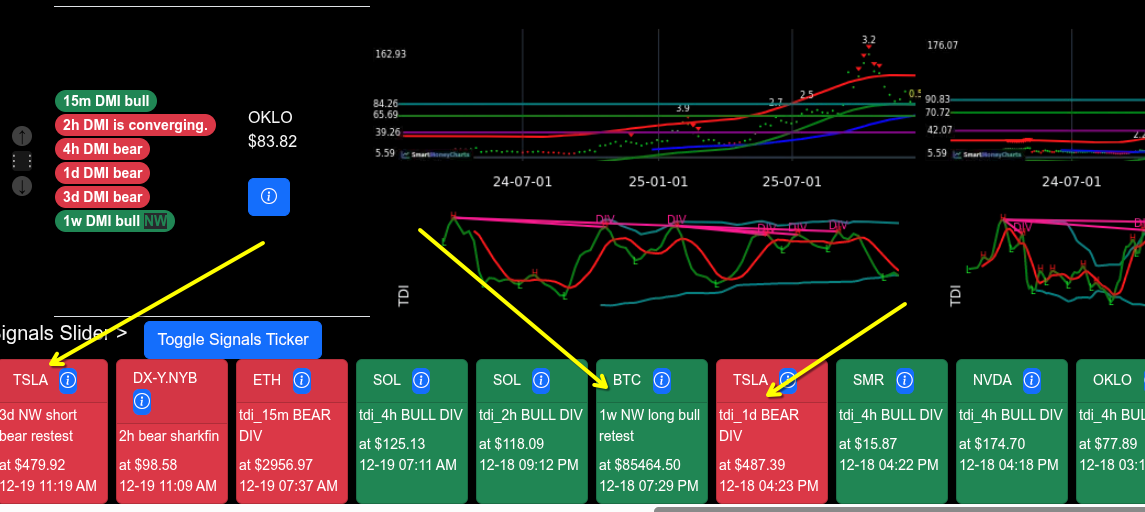
Real-time alerts slide in from the bottom.
Stay in the loop—like having a co-pilot watching your back.
Built for all screen sizes
MultiTimeframe signal scanner view on mobile, ideal on 4k pc connected, works on smart tv browser too!